Passive Ionospheric Sounding and Ranging - The G3PLX System
Equipment Required
Note from LW3HAZ:
There are now alternatives - one system
uses the PC sound card to replace the DSP module. Please check the systems page for more information. The GPS is still necessary to provide
a very precise time reference.
The G3PLX chirp tracking system uses the following components:
- - Stable and accurate HF receiver, in USB mode.
- - 5m vertical antenna in a noise-free environment.
- - DSP unit, the Motorola DSP56002 EVM development kit.
- - GPS receiver with seconds pulse and NMEA data.
- - Win 3.1/95/98 computer, at least a 486/DX66.
- - Phase II EVMCHIRP software by Peter Martinez G3PLX.
The DSP unit is the heart of the system - it receives the audio from the
receiver, filters out the chirps, and measures their amplitude and time. It
also receives time information, in the form of seconds pulses and NMEA
format serial coded time data, which are derived from the GPS unit. The EVM
uses the high precision seconds pulse to interpolate time in conjunction
with its own internal reference. The NMEA (serial data) message allows the
EVM to decide which seconds pulse is which. The time and amplitude data for
each chirp is then sent to the computer for analysis, via another serial
link, using a KISS protocol. Since the data is sampled at 8 kHz, the system
resolution is 125 us.
Several services are provided in the PC, based on the data from the EVM.
Calibration and setup tools allow for choice of serial port, setting a
calibration delay to compensate for the delay in the receiver, and also to
compensate for when the NMEA message arrives relative to the seconds pulse.
You can also choose how the software for the EVM is loaded (it can be
automatic). The receiving frequency is entered (so the software can
extrapolate the chirptime), and the signal level and UTC time (from the GPS)
are displayed.
Three main products are provided by the PC:
- The Chirp Log
- A log of detected chirps, which can be saved to file. This contains
UTC time, signal strength, period and measured delay (chirptime), for
every detected pulse. It does not contain entries for signals too weak
or distorted to be detected as a chirp, but will contain occasional
"hits" caused by strong noise pulses and other interference. Pulses
as close as 1ms are logged independently, so provided the signal is
strong enough and not too distorted, scatter and long path hits will
also record.
- The Chirp Statistics
- A log of chirp statistics, which gives a summary of each known chirptime,
with period, number of detected pulses, and the time of the first and
last detected pulses. The chirptime is averaged over the pulses for the
previous two hours, which enhances the precision. Random noise hits are
eliminated.
- The Waterfall Displays
- There are eight waterfalls, which can be set to monitor any suitable
period and chirptime. The waterfall gives a graphical display of the
signal, and is much more sensitive than the logs. The waterfall relies
on visual interpretation, not software detection of the chirp properties.
The scale of the waterfall is 1 ms/pixel vertically, and 5 minutes/pixel
horizontally. Very complex reception conditions can be displayed.
Part of a Statistics log
Chirp Beacons ZL1BPU
Chirp statistics for local date/time 20/2/00 17:50:31
UTC time from GPS = 17:49:10
Frequency 20983.0 kHz
480   467.77000  01:39  01:39  2
300   223.17635  01:57  13:12  95
720     0.33834  02:03  03:03  4
900   177.55776  02:06  08:51  27
720   281.50998  02:08  02:56  6
360   210.76963  02:37  02:37  2
450   398.76395  02:47  03:17  5
1800 1240.16663  03:54  03:54  2
480    79.01744  05:08  05:08  2
300   249.08083  05:27  05:32  3
The values shown on each line are Period, Chirptime, time of first receipt,
time of last receipt, and finally the number of "hits" detected during the
current session.
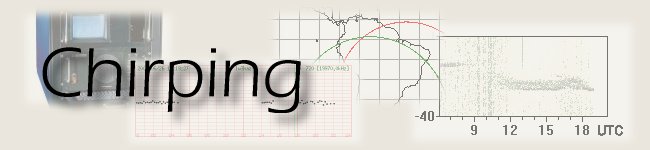
Waterfall display
The Phase II Waterfall display
|
Copyright Murray Greenman and Peter Martinez, 1999 - 2003 |
mail |